
In this lesson, I will use a recurring presentation I have given at the Power Platform World Tour but also online for the great Power BI Manchester User Group and as a Microsoft Power BI Webinar so far.
In the world of adoption, it is a standard best practices to build a “Champion program”.
I propose to use the living stock of Excel heroes in the company to turn them into enthusiast Power BI users. The typical target is the person asking the infamous ” How can I export that report in Excel?”*. From that, you can recognize the appetite for data and the will to smash it into their own kitchen. Which is a pretty good start to embrace Power BI, isn’t it?
To help them in the journey I like to establish bridges between the two worlds and demonstrate what they have in common and to teach them how powerful their practices in Excel can become. And Excel user’s tasks are intuitively using the same approach as the classical BI.
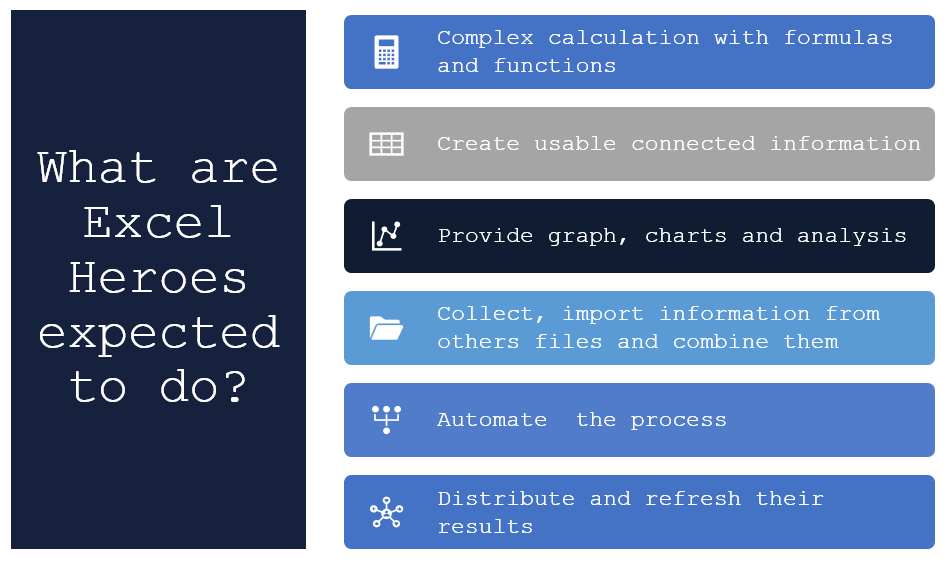
If you order them you see that you are in something familiar.
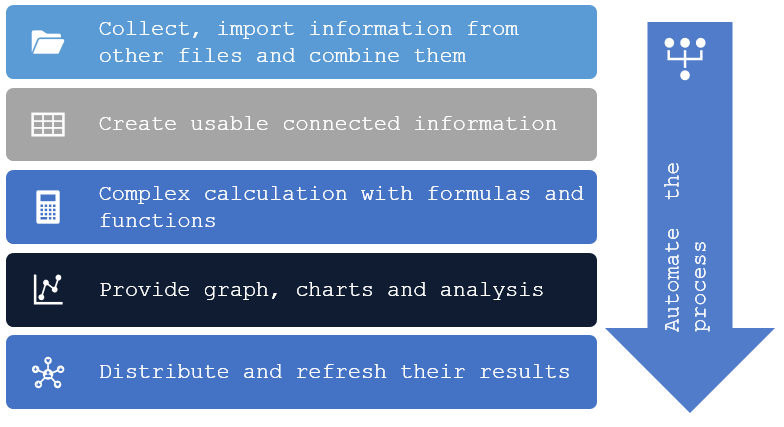
And when you pivot it, this list of tasks becomes obvious:
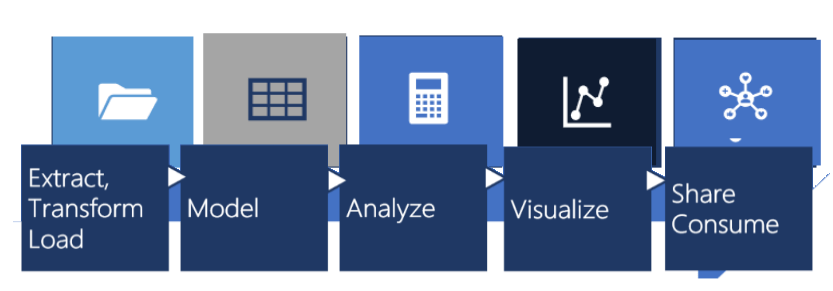
It is then time to compare all of those tasks in each of the tool. The good news is that once you use the right feature in Excel you can be as efficient as you can be in Power BI. So the work you have to do is not convince them to quit Excel. You need to give them enough data culture to use Excel in the right way. Long story short: teach people to use Power Query inside Excel. I have seen tears of joy when people understand that they will not need anymore to repeat each steps manually or to write complicated unmanageable Macros or to fear the broken link of a VLookup.
Then teach them to create a Data Model. The secret weapon is there. I am a genuine adept on the star-schema model. Thinking simple is the key. And I also believe that even end-users can understand Fact/Dimensions concepts.
The Analyse and calculation step is the good moment to step into the DAX train. I like to ask my audience what are their favourite Excel functions. I am never surprised by the answers: you can see that people want to establish connections between the data and to perform aggregations.
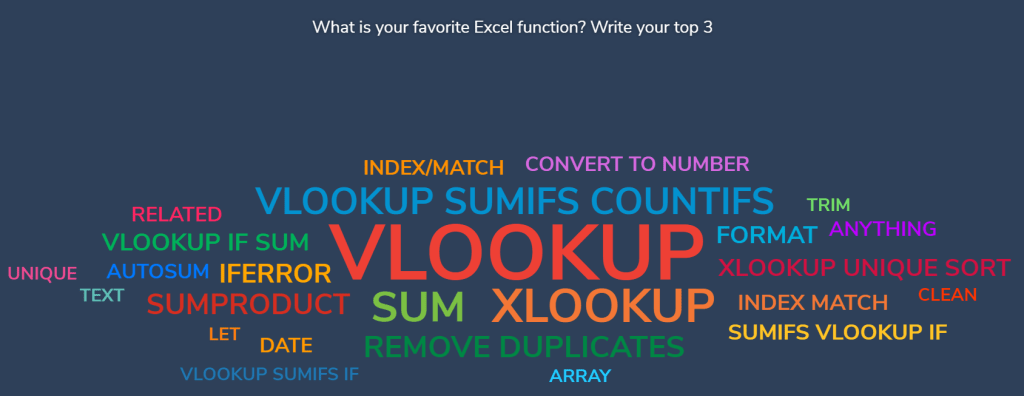
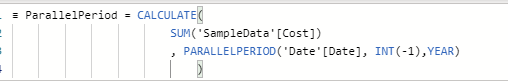
Starting from that it is the moment to put side by side the usual functions and explain how to tackle them in Power BI– some of them becomes useless because of the implicit behaviour of DAX into a Data Model. If the CONTEXT, the calculated columns and the Measure are understood, the difference with the Excel formulas is also understood. You can show them then some time intelligence like this one:

An excellent resource that I use to give a Dax introduction course is the wonderful LazyDax from my friend Arnaud Gastelblum. If you need a self-explained library of DAX function, try it! You can use it with a very large audience.
The next step can make an absolute difference for your audience. I even start with that slide sometimes. Do not fear to use it:
Excel users do not have a solid DataViz culture. You will have two kind of people:
Grid obsessed people that needs to embrace the power of a good visual .
And people already doing complicated visualisations into Excel but with a lot of pain/code/add-ins. Both should be thrilled to see how simple it is to achieve a nice interaction even in the most basic reports.
The last but not least step is to talk about the centralisation of the reports. Excel files are usually client-oriented, and it is prevalent to see a lot of duplicates in the enterprise folders and mailboxes. Sometimes it is even called the “Excel hell”. You will show the publication of the reports in Power BI services and all the managing possibilities around them once published.
That’s all for today folks; I think you get the idea, now lets’ evangelise your Excel flock.
You can find my slides below.
*Every introduction course I am giving on Power BI has a dedicated module around Export, why not, what are the possibilities with Excel and Power BI, and best practices around it.
